
From ZH
A little over a month ago, BofA spooked even the most dovish elements on Wall Street and in the Marriner Eccles building, when the bank said that judging by the explosion of references to surging prices in Q1 earnings calls, the bank concluded that this "pointing to at the very least, “transitory” hyper-inflation ahead." Yes... really:
![]()
Fast forward to today when BofA's economist Alex Lin quantified what his bank qualified to so many shocked gasps one month ago. As Lin writes, with core CPI inflation at 3.8% yoy in May, "we must assess how much of the acceleration in inflation is due to transitory factors, and how much will be sustained over the medium term", a task which virtually everyone is obsessing over (and which can be resolved rather simply).
So to contribute to the discussion, Lin introduces the BofA US "transitory inflation" meter. It will probably came as a surprise to nobody that said meter is currently at an all-time high, "suggesting that there is significant scope for a pullback over the next year."
It also confirms what the bank said last month: that the US is currently in a period of hyperinflation, and hopefully the bank is also right that this period will be transitory.
So how does Lin determine what is and what isn't transitory?
As he explains, economists have long been trying to distinguish between transitory and persistent inflation and "core inflation" was created out of this desire given the volatility of food and energy prices and their lack of signal for broader inflation pressures (core inflation is now more closely followed in real time versus headline inflation even if most consumers end up paying headline prices).
To this end, many of the regional Federal Reserve Banks have created their own alternative measures through which we can measure transitory inflation. Survey based measures of inflation expectations can provide another important perspective of transitory inflation, namely how consumers and economists view things. The BofA US transitory inflation meter accounts for all of this information, utilizing 11 different estimates:
- Core PCE less the Dallas Fed’s trimmed mean PCE
- Core PCE less the San Francisco Fed’s cyclical core PCE
- Core PCE less the San Francisco Fed’s median PCE
- Core CPI less the Cleveland Fed’s trimmed mean CPI
- Core CPI less the Cleveland Fed’s median CPI
- Core CPI less the Atlanta Fed’s sticky CPI
- Core CPI less the Atlanta Fed’s sticky core CPI
- Core CPI less the New York Fed’s Underlying Inflation Gauge – full data
- Core CPI less the New York Fed’s Underlying Inflation Gauge – prices only
- Survey of Professional Forecasters (SPF) 1yr CPI expectations less 10yr CPI expectations
- University of Michigan consumer 1yr inflation expectations less 5-10yr expectations
For each estimate, the gap is further adjusted by the historical average gap between the measures involved, given that they may trend at different levels. For example, the San Francisco Fed’s cyclical core PCE has averaged 2.66% yoy from 1995-2019 whereas core PCE has averaged 1.72% yoy, or a historical gap of 94bp. BofA assumes this does not reflect transitory inflation and must therefore be adjusted out of the real-time gap.
The bank then takes a simple average of these 11 estimates, and calculates the distribution of this average through February 2020, i.e., until the pandemic started. BofA's transitory inflation meter is based on where each data point lies relative to this distribution. Data in the far left tail (e.g. April 2020) have a meter score close to -100, the median of the distribution gets a score of zero and readings in the far right tail, like we saw in May, have a score of nearly +100.
With that background behind us, BofA states matter-of-factly that its meter is currently at an all-time high, which however is immediately spun as positive as it suggests that there is significant scope for a pullback over the next year. Which of course is true. It also suggests that prices -whether permanent or transitory - have never risen faster!
In short, hyperinflation.
![]()
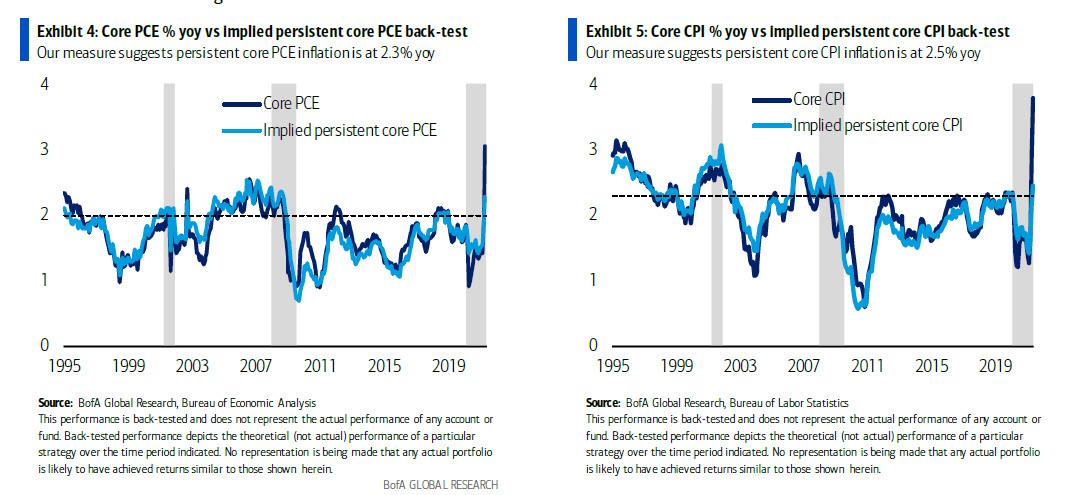
As noted above, the BofA inflation meter does not itself give a sense of persistent inflation, only the bias in broader core inflation. Still, the implied "persistent" (as in non transitory) trends have been rising alongside transitory inflation up to 2.3% for core PCE and 2.5% for core CPI. This, to the BofA economists, "suggests that as transitory inflation pressures ease, core inflation is likely to settle above the Fed’s 2% target."
That's hardly the reason to be buying 10Y TSYs hand over fist, as algos, CTAs and a handful of carbon-based traders are doing today.
So what to do with this information?
First, the good news: according to Lin, high reading in the transitory inflation meter suggests that the persistent inflation trend is likely much lower than current readings of core inflation. Therefore, as transitory stories fade over the medium term it is likely that inflation slows dramatically. Of course, the opposite is true when there is a substantially negative reading in the transitory inflation meter, which suggests significant transitory disinflation with a much higher persistent trend than current core prints.
Applying a 12-month lead for BofA's indicator and comparing it to actual % yoy core PCE and core CPI back to 1996, it appears to pass the smell test.
![]()
Fast forward to today, the transitory inflation meter is at a historically elevated level of 100, indicating that core inflation remains severely biased to the upside. BofA spins this in the only possible, that this argues "for substantial slowing next year back towards the trend in persistent inflation."
Now the not so good news.
The next two charts illustrate the implied persistent inflation trend in core PCE and core CPI compared with the actual measures themselves. BofA's estimates suggest that persistent core inflation has been on the rise alongside all the transitory pressure, with the underlying trend in core PCE at 2.3% and core CPI at 2.5%. Thus, even assuming no further improvement in persistent inflation, as these transitory price pressures ease over the medium term core PCE and core CPI are likely to settle to levels consistent with above-target inflation.
At this point even BofA admits that spinning this data in a positive light is problematic, and Lin writes that "we believe the risks are growing for higher persistent inflation amid wide-scale evidence of inflation pressures, including our own news-based indicator, which reveals that main street attention towards inflation is intensifying further." And while there is a growing laundry list of excuses behind the transitory strength - which we profiled previously - BofA admits that "the risk is that as these pressures remain relevant in the near term, some could become embedded into inflation psychology."

How key data should one track to assess the risks around persistent inflation? Here BofA recommends three factors:
- Sticky inflation measures: These are the components of inflation that tend to be less volatile and more a function of the business cycle. The biggest is Owners’ Equivalent Rent (OER). OER accelerated to a 0.3% mom clip in May, returning to the pre-pandemic trend and therefore signaling a return to target inflation.
- Wages: An increase in wages will facilitate greater consumer price pressure. As highlighted in Wages bubbling up (hot topic), frictions from bottlenecks and labor shortages have underpinned recent wage growth. While some softening could occur as these constraints ease later this year, BofA expects even stronger wage growth by the end of 2022 with the Employment Cost Index above 3% yoy.
- Long run inflation expectations: rising expectations will turn temporary inflation into permanent. Repeated price increases have the ability to fuel inflation expectations. University of Michigan’s 5-10yr expectations mentioned earlier reached 3.0% in May, which is the highest since 2013, before settling back down to 2.8% in the June preliminary survey. Similar moves have been seen in the Survey of Professional Forecasters measures and market-based measures such as 10yr breakevens and 5y5y forward inflation swaps.
Bottom line: whether the record inflation print in BofA's inflation-o-meter is temporary or persistent, the bank writes that it is "increasingly comfortable with the view that core inflation will settle above target next year as transitory stories fade into the background." Consistent with this, after a hot 2021 with core PCE likely above 3% yoy in 4Q and core CPI around 4%, BofA expects cooling to 2.1% yoy and 2.5% yoy in 4Q 2022."
Finally, how will we know when transitory inflation is cooling off or even reversing?
Pay close attention to the monthly trajectory of core inflation. Persistent inflation around target implies an average monthly trend around 0.2% mom, but we could see 0.1% or weaker readings if goods that have been bid up over the pandemic see a negative correction. A negative core inflation is also not out of the question depending on the magnitude of the pullback. Base effects are also a consideration for the % yoy trajectory. The elevated core inflation readings this year create negative base effects in 2022, mainly starting in March.
As such, Lin would expect to see the % yoy rate in core PCE and core CPI cool off more dramatically around that time, in addition to the transitory inflation meter.

